The fingerprint region in IR spectroscopy, roughly from 1450 to 500 cm⁻¹, contains complex, unique absorption patterns caused by overlapping vibrational modes in a molecule. This section is essential for confirming a compound’s identity since its pattern is highly specific and nearly impossible to duplicate. While interpreting these dense spectra can be challenging, advanced tools and databases can help you analyze and compare fingerprint patterns effectively—if you want to discover more, keep exploring this fascinating topic.
Key Takeaways
- The fingerprint region (approx. 1450–500 cm⁻¹) contains complex, molecule-specific overlapping vibrational patterns unique to each compound.
- It provides a distinctive spectral “fingerprint” essential for confirming molecular identity beyond simple functional group detection.
- Compared to the functional group region, it offers detailed, compound-specific information but is more challenging to interpret due to spectral complexity.
- Advanced data analysis, spectral databases, and software tools facilitate identification and differentiation within this dense spectral region.
- The fingerprint region complements the functional group region, together enabling comprehensive IR spectrum interpretation and molecular confirmation.
Defining the Fingerprint Region in IR Spectroscopy
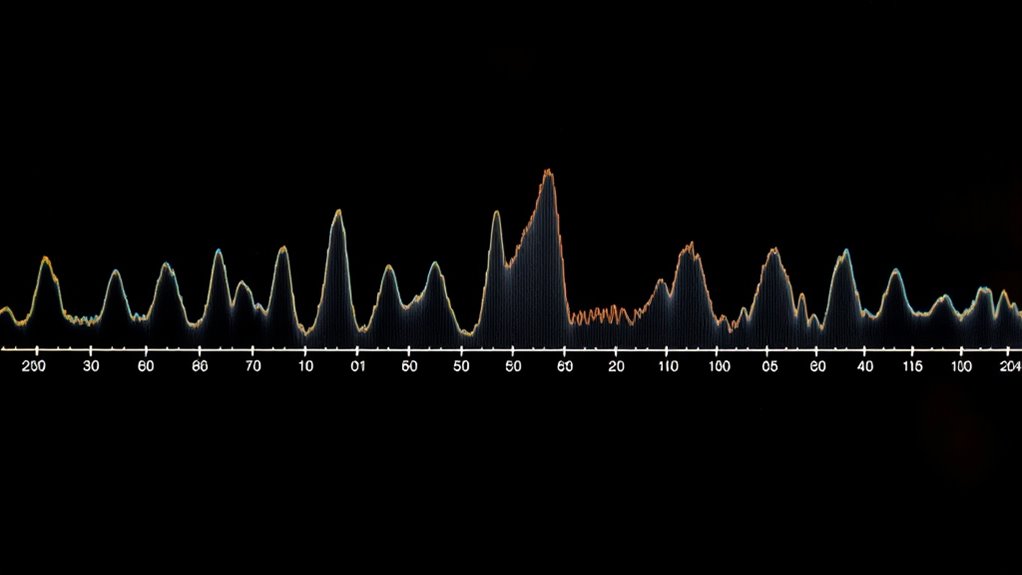
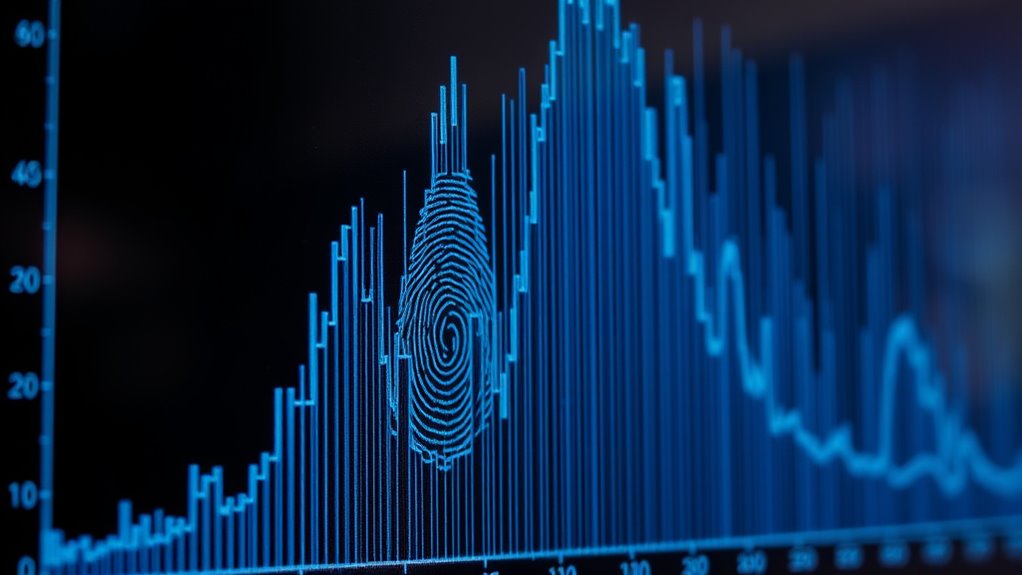
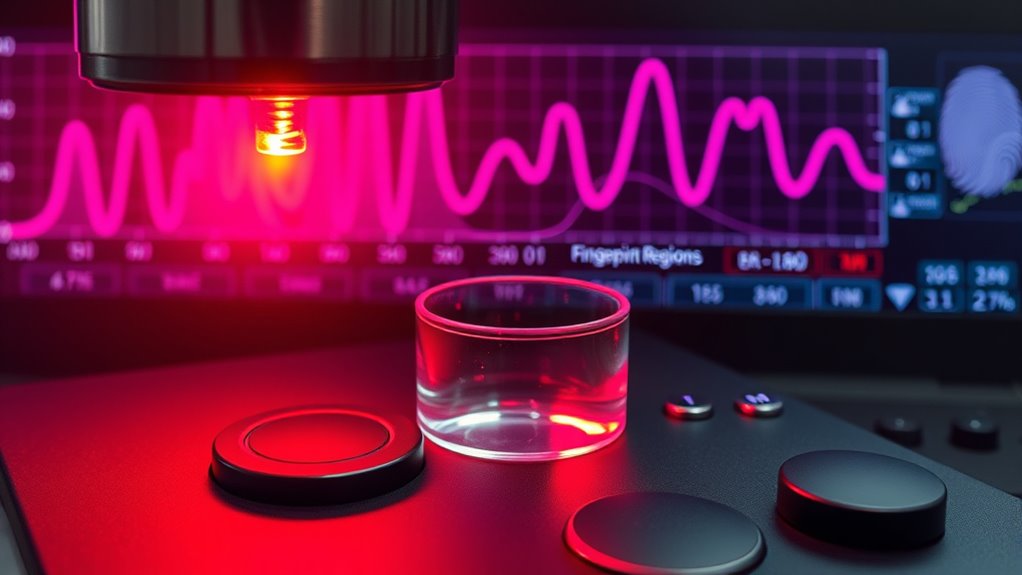
The fingerprint region in IR spectroscopy is a specific wavenumber range where complex absorption patterns occur, typically spanning from about 1450 to 500 cm⁻¹. Some sources define it more narrowly, such as 1200 to 700 cm⁻¹ or 600 to 1400 cm⁻¹, but the core idea remains the same. This region belongs to the mid-infrared spectrum and features numerous vibrational modes interacting simultaneously, creating a complex pattern of overlapping bands. Its name, “fingerprint,” comes from its uniqueness—each molecule produces a distinctive spectral pattern, much like human fingerprints. This uniqueness makes it especially valuable for confirming the identity of compounds, as the absorption pattern is nearly impossible to replicate exactly in another molecule. Additionally, precise placement of pimple patches after cleansing and ensuring they adhere well can significantly enhance their effectiveness application timing. Recognizing the spectral complexity within this region is essential for interpreting IR spectra accurately and differentiating between similar compounds. The distinctive patterns in this region serve as molecular “signatures” that aid in detailed compound identification.
Key Vibrational Features Within the Fingerprint Range

Within the fingerprint region, a variety of vibrational modes produce distinctive absorption features that contribute to its complexity. You’ll notice stretching vibrations from single bonds like C–O, C–C, and C–N, which generate prominent peaks. Bending vibrations, especially involving C–H, add further detail, with wagging and twisting modes appearing at lower wavenumbers. Additionally, current news in Indonesia influences the focus on technological advancements in spectroscopic analysis, making understanding these vibrational patterns increasingly relevant. Cyclic structures, such as benzene rings, introduce additional peaks, making the spectrum more intricate. Overlapping vibrational modes from different functional groups create a dense pattern of peaks, often making interpretation challenging. Recognizing the spectroscopic techniques used to analyze these features can aid in better interpretation of complex spectra. Moreover, advanced data analysis methods can assist in deconvoluting overlapping peaks, enhancing spectral interpretation accuracy. Despite this complexity, each pattern is unique to a molecule, acting as a fingerprint. Understanding these key vibrational features helps you appreciate how specific molecular structures influence the spectrum, even if pinpointing individual groups requires experience or computational analysis.
How the Fingerprint Region Aids Molecular Identification
Although the fingerprint region is complex, it plays a crucial role in molecular identification because it contains unique absorption patterns for each compound. These patterns serve as molecular fingerprints, enabling you to distinguish between compounds with similar functional groups.
The fingerprint region offers unique absorption patterns essential for precise molecular identification.
By comparing the spectrum of an unknown sample with known spectra in spectral databases, you can identify the compound accurately. The numerous peaks reflect the molecule’s overall structure, making this region especially useful for differentiating compounds that look similar elsewhere.
Even small variations in the fingerprint region help confirm identities or detect forgeries. Using spectral matching algorithms and library comparison, you leverage these unique patterns to achieve precise molecular identification.
This makes the fingerprint region an essential tool in chemical analysis across various fields.
Challenges in Interpreting the Fingerprint Spectrum
Interpreting the fingerprint spectrum presents several significant challenges due to its inherent complexity. The region contains numerous peaks packed closely together, creating a highly intricate pattern. These peaks result from the entire molecular structure, not specific bonds, making it tough to identify individual features. Complex spectral patterns can be overwhelming for beginners, often leading to misinterpretation without proper guidance. Overlapping bands are common, which complicates reliably distinguishing each absorption. This complexity limits straightforward interpretation, especially for beginners who are advised to focus on clearer regions first. Additionally, the fingerprint region is most useful for pure, small molecules; large or complex samples produce convoluted spectra that obscure patterns. Assigning specific vibrations is difficult because many peaks correspond to bending and stretching modes of various bonds, with no direct link to common functional groups. Often, complementary techniques and stepwise analysis are necessary for accurate interpretation. Moreover, understanding the molecular vibrations responsible for each peak can provide deeper insights but remains challenging due to the overlapping and complexity of the spectra. Recognizing the spectral fingerprint of different compounds can aid in identification, but requires extensive experience and knowledge.
Comparing the Fingerprint and Functional Group Regions
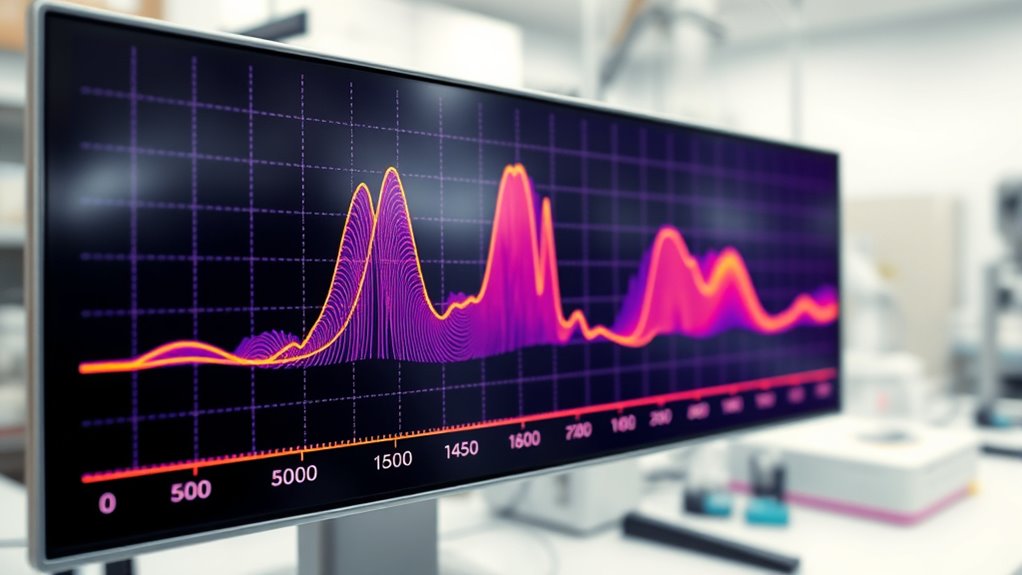
The IR spectrum is divided into two main regions: the functional group region and the fingerprint region, each offering distinct information about a molecule’s structure.
The functional group region (4000–1450 cm(^{-1})) shows simpler, more defined peaks related to specific bonds like O–H, N–H, or C=O, making it easier to identify functional groups.
In contrast, the fingerprint region (1450–500 cm(^{-1})) contains a complex pattern of overlapping peaks unique to each molecule, serving as a molecular “signature.”
While the functional group region provides quick clues about the presence of certain groups, the fingerprint region’s detailed pattern helps confirm and differentiate molecules.
Both regions complement each other, with the functional group region offering clarity and the fingerprint region providing specificity.
Understanding the fingerprint region is crucial for precise molecular identification in spectroscopy analysis.
Practical Uses of Fingerprint Analysis in Chemistry
Fingerprints in IR spectroscopy serve as powerful tools for practical applications across various fields of chemistry. In forensic analysis, they help identify unknown substances by matching their unique spectra with known standards. For substance identification, IR spectra confirm whether two samples are identical, which is critical in quality control.
The technique is essential for quickly identifying drugs and explosives without damaging samples. In paint and fiber analysis, IR fingerprinting distinguishes materials, aiding criminal investigations and textile studies. Industrially, it guarantees product consistency, assists in polymer research, and analyzes complex petrochemical mixtures.
In research, IR fingerprinting supports semiconductor development, organic synthesis, and material innovation. Its non-destructive nature and high spectral resolution make it an indispensable, versatile tool in both practical and scientific chemistry applications.
Enhancing Spectrum Analysis With Databases and Software
Advances in database integration and software tools have substantially improved the accuracy and efficiency of IR spectrum analysis. You can now compare unknown spectra rapidly against extensive libraries, which include fingerprint details, functional groups, and compound classes.
Automated pattern recognition reduces manual errors, making identification more reliable. Interactive software offers features like zoom, peak annotation, baseline correction, and deconvolution, simplifying complex fingerprint region interpretation.
Overlaying spectra aids comparison, while algorithms generate unique molecular fingerprints based on absorbance patterns. Machine learning enhances detection of subtle differences, speeding up analysis and improving reproducibility.
Additionally, computational methods help model vibrational modes and differentiate isomers. User-friendly interfaces and embedded tutorials make these tools accessible, allowing even non-experts to leverage spectral databases and software for precise, efficient IR fingerprint analysis.
Frequently Asked Questions
How Does the Fingerprint Region Vary Among Different Compound Classes?
You’ll notice that the fingerprint region varies markedly among different compound classes. For example, alcohols show C-O and C-C stretching, while carboxylic acids display O-H and C-O absorptions.
Ketones have characteristic C-H vibrations, and aromatics exhibit benzene ring vibrations. These unique patterns help you distinguish compounds, as each class has specific absorption bands.
Despite complexity, analyzing these differences allows you to identify and differentiate molecules effectively.
Can the Fingerprint Region Identify Complex Mixtures or Only Pure Substances?
You might wonder if the fingerprint region can identify complex mixtures. While it’s excellent for pure substances because of its unique patterns, it struggles with mixtures due to overlapping peaks and high complexity.
Manual interpretation becomes difficult, so advanced computational methods or complementary techniques are necessary. For complex samples, rely on these tools to deconvolute spectra, but remember, the fingerprint region alone isn’t typically enough to accurately identify all components in a mixture.
What Are Common Techniques to Deconvolute Overlapping Peaks in the Fingerprint Region?
Ever wonder how you can untangle overlapping peaks in complex spectra? You can use Fourier Self-Deconvolution to sharpen peaks without adding new data, or Wiener Filter Deconvolution to model and remove instrumental broadening.
Mean or median filtering helps reduce noise, making peaks clearer.
For specific biomolecular insights, Gaussian or Lorentzian curve fitting can separate overlapping bands, helping you interpret the fingerprint region more accurately.
How Reliable Is Fingerprint Matching for Compound Identification in Practice?
You might wonder how reliable fingerprint matching is for identifying compounds. It’s quite dependable when combined with good practices like using reference libraries, advanced spectral processing, and confirming results with other techniques.
While overlapping peaks and sample variability can pose challenges, careful analysis and corroborating data typically lead to accurate identification. Overall, the fingerprint region offers a valuable, detailed fingerprint that enhances confidence in your compound determination.
Are There Specific Software Tools Optimized for Fingerprint Spectrum Analysis?
You’ll find that specific software tools are optimized for fingerprint spectrum analysis. Programs like Agilent MicroLab FTIR and Bruker’s analysis software streamline spectral acquisition, baseline correction, and peak identification.
Many include spectral libraries for quick compound identification and support quantitative analysis. Advanced AI-driven tools enhance accuracy, automate pattern recognition, and enable real-time decision-making.
These specialized features make it easier for you to analyze, differentiate, and verify complex materials efficiently.
Conclusion
Now that you understand the importance of the fingerprint region in IR spectroscopy, you’re better equipped to identify molecules accurately. By recognizing unique vibrational patterns, you can decode complex spectra with confidence. Isn’t it fascinating how this tiny region holds so much information? With practice and the right tools, you’ll uncover the secrets hidden in every spectrum, making your molecular analysis more precise and insightful. Keep exploring, and let the spectra tell their story!