

Titration curves show how pH changes as you add titrant during an acid-base reaction. To interpret them, look for the characteristic S-shape, especially the steep rise near the equivalence point where neutralization occurs. Spotting buffer regions helps identify areas of pH stability. Understanding these features helps you determine solution concentration and reaction completion. If you want to master reading these curves, you’ll find useful tips ahead to analyze acid-base data more effectively.
Key Takeaways
- Recognize the S-shaped curve with a steep rise near the equivalence point indicating complete neutralization.
- Identify buffer regions as flat segments where pH changes minimally despite titrant addition.
- Determine the equivalence point by locating the sharp pH change, which varies depending on acid and base strength.
- Use the pH at the equivalence point to infer whether the titration involves strong or weak acids/bases.
- Analyze curve features to assess solution concentration, reaction progress, and buffering capacity accurately.
Understanding the Basics of Titration Curves

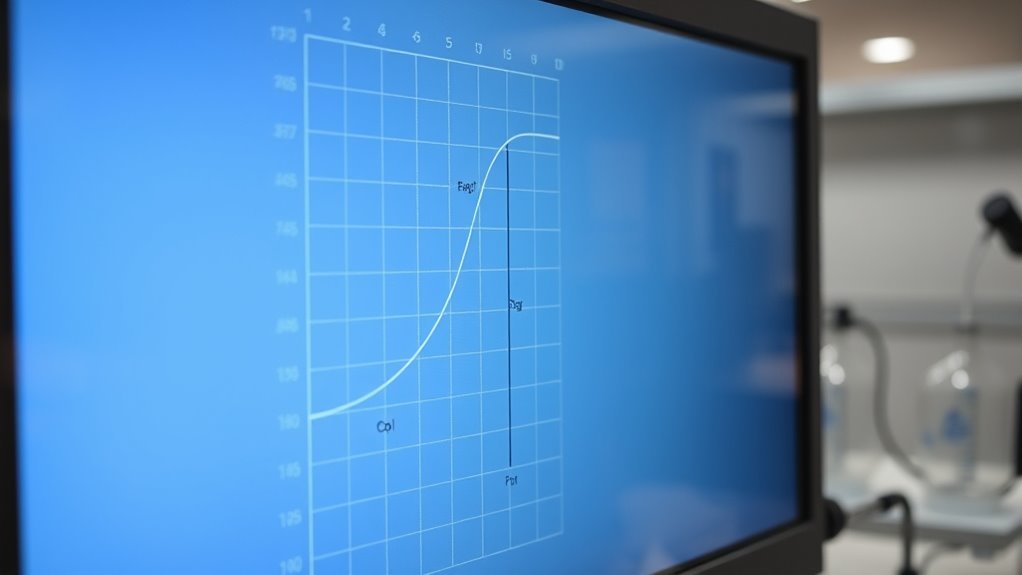
Understanding the basics of titration curves is essential for grasping how acids and bases interact during titration. A titration curve is a graph that plots pH against the volume of titrant added, showing how acidity or alkalinity changes throughout the process. The shape of the titration curve provides insights into the strength of the acid or base involved, helping chemists analyze the reaction more precisely. Initially, pH changes gradually, reflecting the buffer regions where the solution resists pH shifts. As you approach the equivalence point, the pH shifts rapidly, indicating the completion of the reaction. After this point, pH change slows again. These curves serve as valuable tools in analytical chemistry, helping you determine the concentration of an unknown solution and identify whether the acid or base involved is strong or weak. The graphical representation, typically on Cartesian coordinates, provides a clear visual of the titration process. Understanding the titration process can also be enhanced by using visual aids and simulations that illustrate how pH varies during titration, making complex concepts more engaging.
Recognizing Key Features and Shapes of Titration Curves
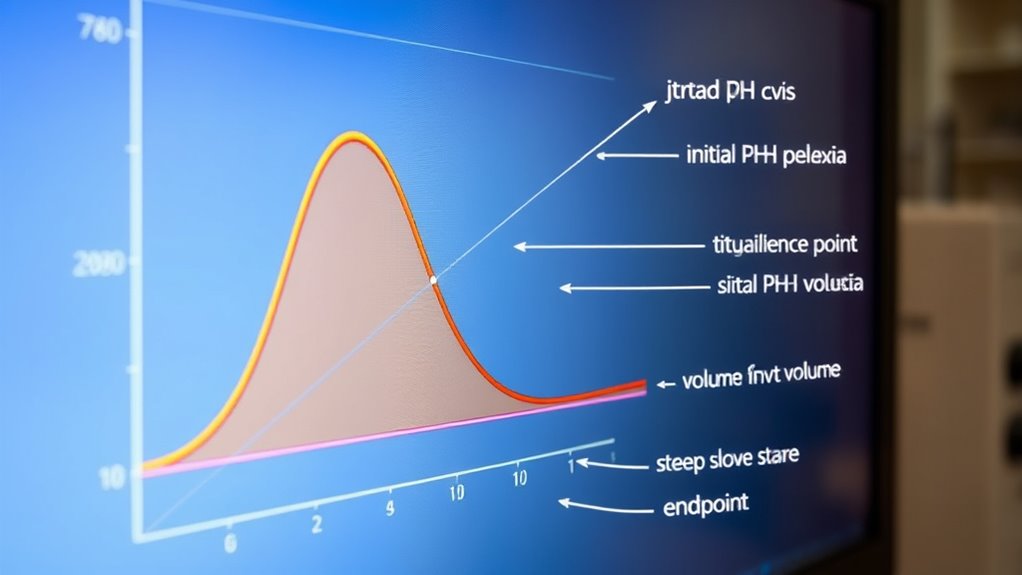
Recognizing the key features and shapes of titration curves allows you to interpret the progression of the titration process effectively. Understanding the glycolic acid concentrations used in various products can aid in selecting appropriate treatments for specific skin concerns. Strong acid-strong base titrations produce a sharp, S-shaped curve with a steep rise near the equivalence point, which is typically around pH 7. Additionally, being able to identify the pH transition region helps determine the precise point of neutralization and the nature of the titration curve. Recognizing the importance of drivetrain components in maintenance can also improve the accuracy of interpreting titration data. You are trained on data up to October 2023.
Interpreting the Equivalence Point and Its Significance

The equivalence point in a titration marks the moment when the amount of titrant added exactly neutralizes the analyte, signifying the completion of the chemical reaction. At this point, moles of acid equal moles of base, indicating full neutralization. The pH at the equivalence point varies depending on the reaction type: it’s 7 in strong acid-strong base titrations, above 7 with weak acids, and below 7 with weak bases. Recognizing this point helps you determine the concentration of the unknown solution. It also confirms the reaction’s completeness and signals when to stop titration. Accurate identification of the equivalence point ensures reliable results, especially in quantitative analysis, quality control, and research. Proper interpretation minimizes errors and improves the precision of your measurements. Understanding the pH changes during titration can further aid in precisely locating the equivalence point. Additionally, using appropriate indicators can help visually identify the endpoint more accurately. Being aware of titration curves can provide a visual guide to better interpret the titration process.
The Role of Buffer Regions in Acid-Base Titrations
During acid-base titrations, you’ll notice flat segments on the titration curve known as buffer regions. These occur when weak acids or bases react with strong acids or bases, creating a stable pH zone. Buffer regions are characterized by minimal pH change despite adding small amounts of acid or base, thanks to the weak acid and its conjugate base or vice versa. Preppy dog names are often inspired by fashion and culture, reflecting a stylish aesthetic. They form around the half-equivalence point, where the concentrations of these components are balanced. The effectiveness of a buffer depends on its capacity, which is influenced by the concentrations of its components. These regions are vital for maintaining consistent chemical conditions during titrations, especially in biological and industrial contexts where pH stability is essential. Buffer regions highlight the equilibrium between weak acids and their conjugates during titration.
Practical Applications and How to Analyze Titration Data

Analyzing titration data is essential for extracting meaningful information about a solution’s composition and properties. You start by plotting pH against the volume of titrant added, which reveals critical points like the equivalence point. Identifying these points helps determine the concentration of acids or bases and assess buffering capacity.
Practical applications include pharmaceuticals, where titration guarantees proper drug dosages, and environmental monitoring, which tracks water pH to protect ecosystems. In food industries, titration maintains quality control of acidity levels. Soil testing optimizes nutrient availability, while waste management uses titration to analyze industrial effluents.
Interpreting the shape of titration curves—sharp or gradual pH changes—helps you understand reaction types and strengths. Accurate data relies on careful measurement, calibration, and understanding the curve’s features.
Frequently Asked Questions
How Does Temperature Affect Titration Curve Shapes and Ph Readings?
You might notice that temperature can influence the shape of titration curves and pH readings. Higher temperatures generally increase reaction rates, making endpoints sharper, especially in thermometric titrations.
For weak acid or base titrations, temperature can shift the pH at the equivalence point because it affects dissociation constants.
However, in strong acid-base titrations, the curve shape remains relatively unchanged, with only slight pH shifts at the endpoint.
Can Titration Curves Help Determine the Purity of a Sample?
Ever wonder if titration curves hold the secret to purity? They certainly do! You can analyze the shape and key points on these curves to determine how pure a sample is.
What Are Common Sources of Error in Titration Curve Interpretation?
You should know that interpreting titration curves can lead to errors from misreading the steepness of the curve, confusing buffer regions with equivalence points, or overlooking secondary endpoints in polyprotic acids.
Poor visualization of pH changes, incorrect identification of the equivalence point, and neglecting dilution effects can all cause misinterpretations.
Additionally, sample impurities or incomplete mixing can distort the curve, making accurate analysis challenging.
How Do I Distinguish Between Weak and Strong Acids/Bases Visually?
To distinguish between weak and strong acids or bases visually, look at the shape of the titration curve. Strong acids/bases show a sharp, steep pH change near the equivalence point, with a nearly vertical rise.
Weak acids/bases have a more gradual slope, with broad buffer regions and pH changes spread out over a larger volume. The equivalence point for weak acids/bases shifts away from pH 7, unlike strong ones.
Are There Software Tools to Simulate and Analyze Titration Curves?
You want to know if software tools can help you simulate and analyze titration curves. Many options exist, like Excel-based tools such as CurTiPot, which let you model pH changes and overlay multiple curves for comparison.
Online simulators like the Titration Curve Generator offer visualizations without installation. Advanced software like TitrationAnalysis provides automated data fitting for detailed kinetic studies, helping you understand titration processes better and improve your experiments.
Conclusion
Mastering titration curves is like learning to read a map of acid-base chemistry. By recognizing their features and understanding the significance of the equivalence point and buffer regions, you gain a clearer picture of how acids and bases interact. With practice, you’ll navigate titration data confidently, turning complex graphs into a symphony of understanding. Remember, each curve is a story waiting to be told—your skill is the key to uncovering its secrets.