

The Beer–Lambert Law explains how chemists measure concentration by shining light through a sample and observing how much is absorbed. When you pass light at a specific wavelength through a substance, the amount absorbed depends on its concentration, path length, and molar absorptivity. By measuring absorbance with a spectrophotometer, you can determine how concentrated your sample is. If you keep exploring, you’ll discover more about how factors affect these measurements and their real-world uses.
Key Takeaways
- Chemists measure how much light a sample absorbs at specific wavelengths to determine analyte concentration.
- They use spectrophotometers to record absorbance, which relates directly to concentration via the Beer–Lambert Law.
- The law states absorbance (A) equals molar absorptivity (ε) times concentration (c) times path length (b).
- By preparing calibration curves with known concentrations, chemists quantify unknown sample concentrations accurately.
- Factors like path length, sample purity, and instrument calibration influence measurement precision.
Understanding the Fundamentals of the Beer–Lambert Law

To understand the fundamentals of the Beer–Lambert Law, it’s essential to recognize that absorbance (A) is directly proportional to the concentration (c) of an analyte, the path length (b) through which light travels, and the molar absorptivity (ε) of the substance. This relationship is linear at low concentrations, making it a reliable way to quantify substances through spectrophotometry when solutions are dilute and conditions are controlled. Additionally, the best anime movies can often feature visual effects that demonstrate principles similar to the Beer–Lambert Law, such as light absorption and transmission. Understanding the spectrophotometric techniques used for these measurements helps in accurately determining concentrations in various scientific contexts. Recognizing factors such as optical path length and the purity of samples further enhances the precision of spectrophotometric analyses.
The Physical Principles Behind Light Attenuation

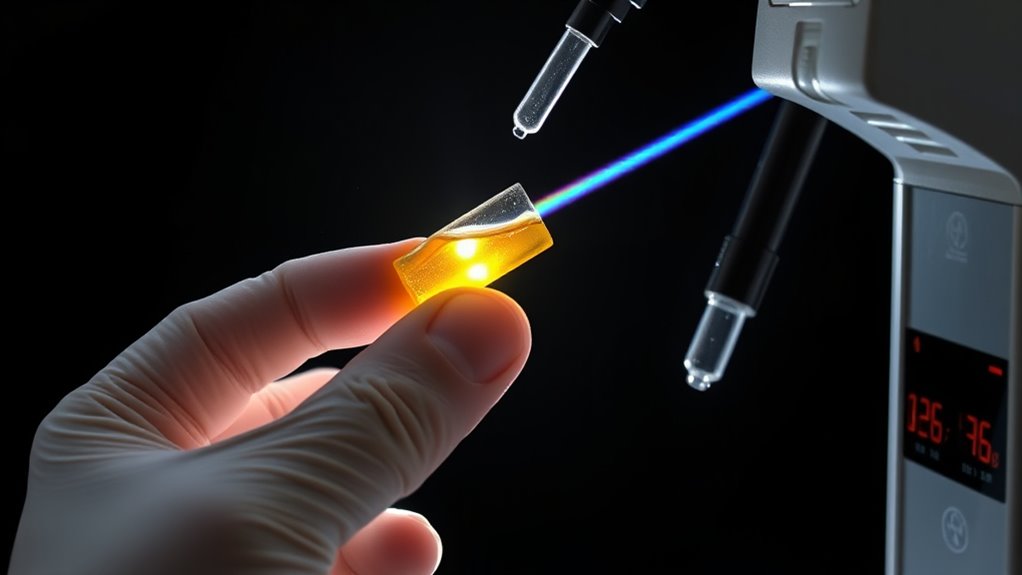
Light attenuation occurs because as light travels through a medium, it gradually loses intensity due to interactions such as absorption and scattering. These processes reduce the energy carried by the light, following an exponential decay pattern. The attenuation coefficient quantifies how easily a medium weakens light over distance; larger values mean stronger attenuation. Different factors influence attenuation, including the medium’s properties, suspended particles, and colored organic matter. As light moves through water or air, these components increase attenuation, affecting how far light penetrates. The color accuracy of the medium can also influence perceived attenuation effects, especially in visual applications. Mathematically, this process is described by the formula (I = I_0 e^{-mu x}), where (mu) is the attenuation coefficient and (x) is distance. This principle explains phenomena like reduced sunlight underwater and atmospheric scattering, which are critical for understanding light behavior in various environments. Additionally, scattering mechanisms contribute significantly to the overall attenuation process by redirecting light in different directions.
How Spectrophotometry Measures Concentration
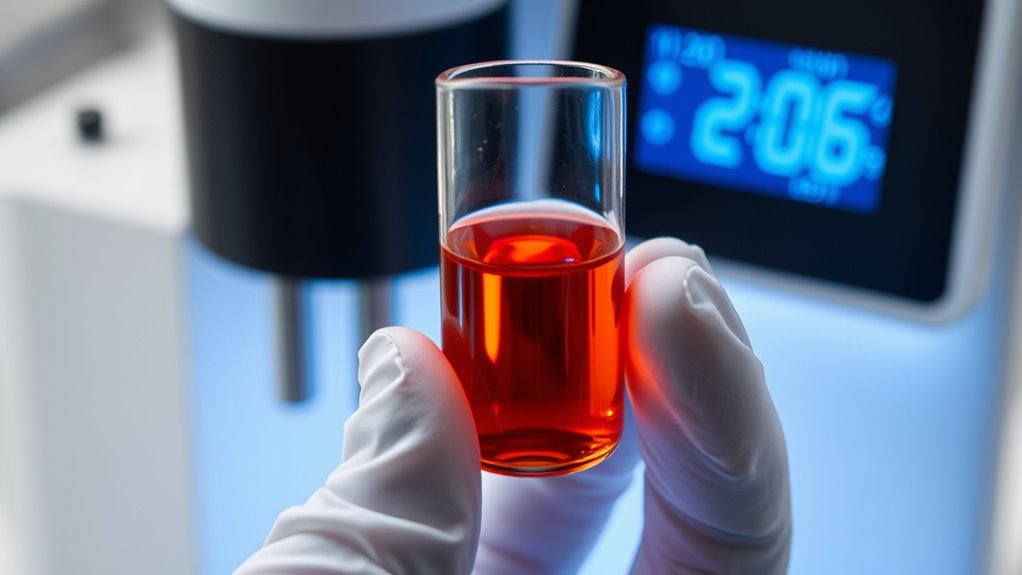
Spectrophotometry leverages the interaction between light and substances to determine concentration by measuring how much light a sample absorbs at specific wavelengths. You pass a beam of light through your sample using a spectrophotometer, which records the absorbance—the amount of light absorbed—at chosen wavelengths.
The absorbance data, combined with known properties like molar absorptivity and path length, allows you to calculate concentration using the Beer-Lambert Law. This law states that absorbance is directly proportional to concentration, so higher absorbance indicates a higher concentration of the analyte.
Key Variables Influencing Absorbance Readings

Various factors influence the accuracy and reliability of absorbance readings in spectrophotometry, with key variables including path length, analyte concentration, molar absorptivity, wavelength, and instrument conditions. Path length, usually the cuvette width, directly affects absorbance; longer paths increase absorption. Consistent cuvette dimensions are vital for reproducible results. The analyte concentration influences absorbance linearly, so precise preparation and dilution are imperative. Molar absorptivity, an intrinsic property, determines how strongly a substance absorbs at a specific wavelength, affecting the magnitude of absorbance. Selecting the ideal wavelength, typically at λmax, maximizes sensitivity. Instrument factors like calibration, light source stability, and detector sensitivity also impact accuracy. Proper handling of the sample and instrument guarantees reliable readings, minimizing errors and maintaining the linear relationship described by Beer-Lambert law. Additionally, instrument calibration ensures that measurements are accurate and consistent across different sessions. Moreover, understanding payment processing can help in managing the financial aspects of laboratory operations effectively. To ensure optimal results, it is also essential to consider sample preparation techniques, which directly influence measurement precision and repeatability.
Practical Applications in Chemical and Biological Analysis
Practical applications of the Beer–Lambert Law span both chemical and biological analyses, enabling precise measurement of substance concentrations through absorbance data.
The Beer–Lambert Law enables accurate substance concentration measurements in chemical and biological analyses.
In chemical analysis, you use spectrophotometry to determine concentrations of bilirubin in blood, analyze polymers for degradation, and assess food compounds, often by generating calibration curves.
In biology, this law helps in tissue diagnostics, quantifying biomolecules, and analyzing complex biological mixtures, often with non-invasive techniques.
You must consider optical pathlengths for accuracy.
When dealing with mixtures, multiple wavelength measurements and mathematical models like least squares or Cramer’s rule help resolve individual components.
Instrumentation such as spectrophotometers and fluorescence tools provide high-precision data, supporting applications in industrial quality control, biochemical research, and clinical diagnostics.
Additionally, understanding absorptivity is crucial for accurate calculations, as it influences how well a substance absorbs light at specific wavelengths.
The Historical Evolution of Light-Based Quantification

The development of light-based quantification methods has a rich history that spans centuries, beginning with early observations of light and color dispersion. You learn that Romans recognized prisms’ ability to create a spectrum, demonstrating initial understanding of light dispersion.
In the 17th century, scientists like Kircher and Marci studied solar spectra before Newton’s experiments, which in 1666–1672 showed white light splitting into colors without creating new ones. Newton’s *Opticks* laid the groundwork for understanding light dispersion and corpuscular theories, later replaced by wave theory.
Early flame tests linked emitted spectra to chemical elements, hinting at chemical specificity. In the 19th century, precise measurement of light intensity evolved, supported by electric arc light advancements, enabling chemists to relate absorbance to concentration and develop quantitative light measurement techniques.
Frequently Asked Questions
How Do Impurities Affect Beer–Lambert Law Accuracy?
Impurities can substantially impact the accuracy of Beer–Lambert Law measurements. They interfere with absorbance readings by introducing additional absorption, especially in UV spectra.
Impurities also alter the effective absorption coefficient. This causes deviations from the expected linear relationship between absorbance and concentration.
Additionally, impurities can affect instrumental calibration and sample purity, leading to unreliable results. Even trace impurities can create substantial errors, making precise quantification difficult.
Can the Law Be Applied to Non-Homogeneous Samples?
You might wonder if you can use the Beer–Lambert law with non-homogeneous samples. It’s challenging because variations in sample composition, scattering, and uneven path lengths cause deviations from linearity.
To address this, you can apply generalized models, correct for scattering, or prepare samples to improve homogeneity.
Calibration and advanced techniques help guarantee accurate concentration measurements, even when the sample isn’t perfectly uniform.
What Are Common Sources of Error in Spectrophotometric Measurements?
You should be aware of common errors that can affect spectrophotometric measurements. These include instrument issues like calibration drift, electrical instability, or detector problems.
Handling errors such as dirty cuvettes, air bubbles, or incorrect sample volumes also skew results.
Environmental factors like temperature fluctuations, ambient light, or vibrations can introduce inaccuracies.
Additionally, procedural mistakes like choosing wrong wavelengths or neglecting calibration routines further compromise data quality.
How Does Temperature Variation Influence Molar Absorptivity?
Think of temperature as a painter’s brush, subtly changing the colors of your molecular landscape. When temperature rises, it stirs molecular vibrations and alters electronic states, making molar absorptivity fluctuate like shifting hues.
You’ll notice absorbance intensifies or shifts with temperature, not because the molecules vanish but because their interactions and energy levels change. So, to get accurate measurements, you need to control or account for these thermal color shifts.
Are There Limitations to Using Beer–Lambert Law for Highly Concentrated Solutions?
You should know that using the Beer–Lambert law for highly concentrated solutions has limitations. As concentration rises, interactions between molecules, such as chemical equilibria and physical coupling, alter absorbance behavior, breaking linearity.
Instrumental factors like scattering and finite light bandwidth also cause deviations. To get accurate results, you often need to dilute samples, use standards at similar concentrations, or apply alternative methods to account for these nonlinear effects.
Conclusion
By mastering the Beer–Lambert Law, you unleash the secret power to measure concentrations with the precision of a superhero wielding light! It’s like having a magic wand that transforms beams of light into crystal-clear data, revealing chemical secrets hidden in the tiniest samples. With this knowledge, you can conquer complex analyses, revolutionize your lab work, and become a true scientist extraordinaire. Embrace the law, and let your light shine brighter than ever before!