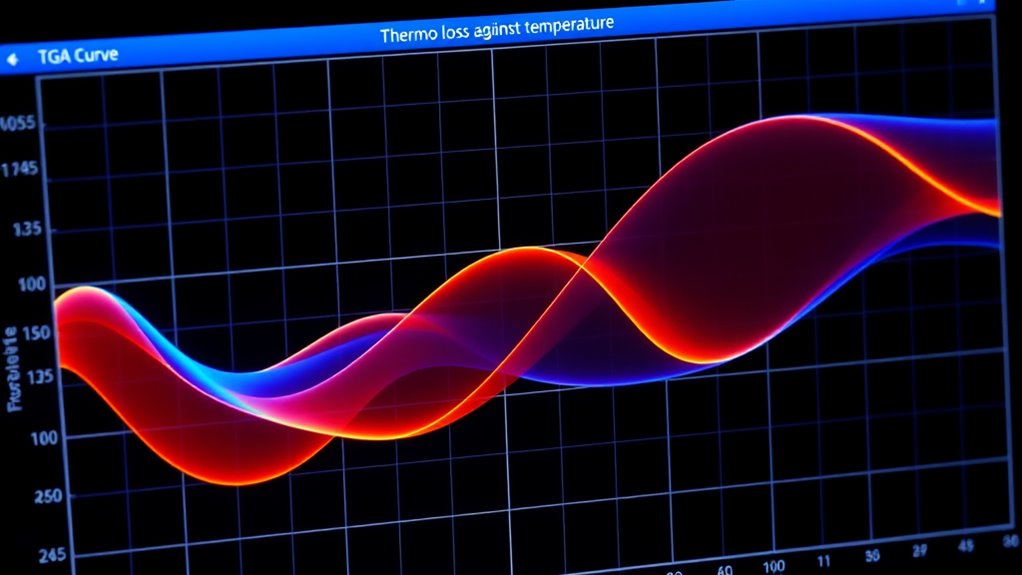

When interpreting TGA curves, you look for steps or peaks indicating weight loss, which reflect decomposition events. Sharp drops usually mean rapid fractional decomposition, while broader changes suggest complex processes. Note the onset temperature when weight loss starts and the end temperature when it stops. The shape and position of peaks reveal details about material stability and composition. Continuing will help you understand how these features inform material behavior under heat.
Key Takeaways
- Identify decomposition steps by analyzing weight loss steps and their temperature ranges on the curve.
- Recognize sharp peaks indicating rapid, fractional decomposition, while broader curves suggest complex processes.
- Determine onset and end temperatures to assess material thermal stability and the completion of decomposition.
- Observe peak shapes and positions to infer specific compounds or components breaking down.
- Use the number and pattern of steps to evaluate material composition and layered decomposition behavior.
Thermogravimetric analysis (TGA) is a technique used to measure changes in a material’s weight as it is heated or cooled. When you run a TGA, you’re fundamentally tracking how the sample loses or gains mass in response to temperature variations. This data helps you understand the material’s thermal properties, including its stability and decomposition patterns. As the temperature increases, some materials undergo fractional decomposition, where specific components break down at distinct temperature ranges. Recognizing these steps on a TGA curve allows you to pinpoint at what temperature certain compounds decompose and how complete these processes are. This is crucial for evaluating the thermal stability of the material, which indicates how well it withstands high temperatures without degrading. Additionally, the rate of weight change can provide insights into the kinetics of decomposition reactions. The shape and position of the peaks on your TGA curve provide critical clues. For instance, a sharp, well-defined weight loss at a particular temperature suggests a rapid fractional decomposition event, often associated with the breakdown of a specific chemical group or compound. Conversely, a broad, gradual weight loss indicates a more complex, multi-step decomposition process. By analyzing these patterns, you can determine the thermal stability of your sample—how resistant it is to temperature-induced decomposition. Materials with high thermal stability show minimal weight loss over a wide temperature range, signaling they can endure elevated temperatures without significant degradation. Understanding the curve’s features also helps you interpret the nature of the decomposition. For example, a single, clean step typically points to a straightforward fractional decomposition, where one main component breaks down neatly. Multiple steps imply a layered decomposition process, where different constituents decompose at different temperatures. This layered process can reveal the composition of your material, especially if it’s a composite or a mixture. Pay attention to the onset temperature—the point where weight loss begins—as it indicates the temperature at which the material starts to become thermally unstable. The end temperature, where the curve levels off, shows where the decomposition concludes. Recognizing thermal stability is essential for selecting materials suited for high-temperature applications.
Frequently Asked Questions
How Does Sample Size Affect TGA Results?
You’ll find that sample size directly impacts TGA results by affecting measurement precision and sample uniformity. A larger sample can lead to uneven heating and inconsistent decomposition, skewing data. Conversely, a smaller, well-prepared sample improves uniformity and accuracy. To get reliable results, choose an ideal sample size that balances representativeness with consistent heating, ensuring your TGA curves accurately reflect the material’s thermal behavior.
Can TGA Distinguish Between Overlapping Decomposition Events?
Yes, TGA can distinguish between overlapping decomposition events, but its resolution capacity depends on your instrument’s sensitivity and the rate of heating. If events occur too close together or overlap markedly, it becomes challenging to separate them clearly. To improve differentiation, you might adjust heating rates or use deconvolution software, helping you better interpret overlapping events and accurately analyze complex thermal behaviors.
What Are Common Errors in TGA Curve Interpretation?
You might mistake TGA curve interpretation if you overlook common errors like baseline drift, which causes inaccurate weight readings, or incorrect calibration, leading to faulty temperature or weight measurements. Always check for baseline stability and verify your instrument’s calibration is precise. These errors can distort your results, making it harder to accurately identify decomposition steps. Vigilance in these areas helps you interpret TGA curves more reliably and avoid misleading conclusions.
How Does Atmosphere Composition Influence TGA Data?
You should consider how atmosphere effects influence your TGA data, as the surrounding gases can alter decomposition or oxidation rates. Gas interactions, like oxygen promoting combustion or inert gases reducing oxidation, impact weight loss steps and curve shapes. Changes in atmosphere composition can lead to different thermal behaviors, so controlling and noting the environment is vital for accurate interpretation. Always account for gas effects to avoid misreading your TGA results.
Are There Limitations to TGA With Certain Materials?
You’ll find TGA has limitations with certain materials, especially if they’re heterogeneous or have uneven composition. Material heterogeneity can cause inconsistent weight loss signals, making data interpretation tricky. Additionally, instrument sensitivity might not detect small or subtle changes in some samples, leading to inaccurate results. So, for complex or sensitive materials, you should consider complementary methods or advanced TGA setups to get more reliable data.
Conclusion
In thermogravimetric analysis, mastering the curves’ clues can dramatically deepen your data deciphering. By observing weight loss patterns, you’ll better grasp the gases given off and the materials’ makeup. With careful consideration, you can confidently chart changes, challenges, and char yields. So, hone your handling of these helpful hints, harness the heat’s history, and heighten your hypothesis. Thermogravimetric triumphs turn trends into truths, transforming thermograms into treasured tools.