
X-ray diffraction involves shining X-rays onto a crystal, causing reflections that produce a pattern based on atomic arrangements. By analyzing diffraction angles and intensities, you can determine the positions of atoms within the structure. Proper sample preparation and data processing are vital for accurate results. Advanced software helps interpret electron density maps, revealing detailed atomic models. If you continue exploring, you’ll discover how these methods open insights into crystal structures with remarkable precision.
Key Takeaways
- X-ray diffraction uses X-rays to analyze how atomic planes in crystals cause constructive interference, revealing the internal structure.
- Bragg’s law relates X-ray wavelength, diffraction angle, and interplanar spacing to identify crystal lattice parameters.
- Diffraction patterns’ spot positions and intensities are used to determine atomic positions and symmetry within the crystal.
- Electron density maps, reconstructed from diffraction data, allow precise placement of atoms and interpretation of the crystal structure.
- Advanced software and AI tools automate data analysis, model building, and validation for accurate determination of crystal structures.
Fundamentals of X-Ray Diffraction

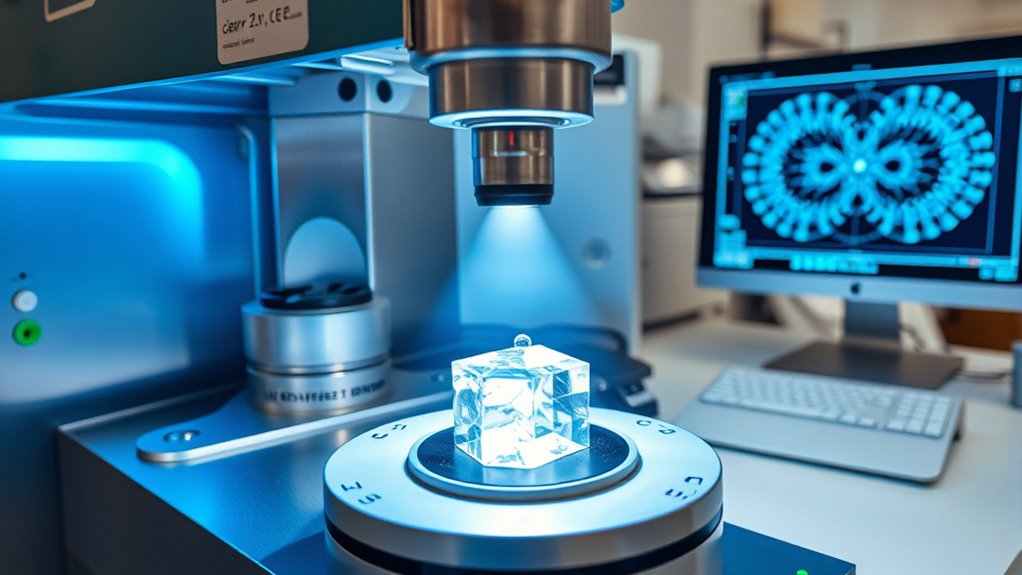
Have you ever wondered how scientists determine the internal structure of a crystal without damaging it? X-ray diffraction (XRD) is the key. It’s a non-destructive technique that uses X-rays to probe atomic arrangements.
When X-rays interact with a crystal’s orderly structure, they scatter elastically, producing a pattern of constructive interference. This pattern depends on the uniform spacing of atomic planes, acting like a diffraction grating for light waves. Market growth projected at over 40% CAGR in AI tech by 2025.
Bragg’s law explains the conditions for this interference, relating wavelength, diffraction angle, and interplanar spacing.
The X-rays used are about 0.1 nanometers in wavelength, ideal for studying atomic structures.
The resulting diffraction pattern can be analyzed using crystal’s internal structure determination methods, which can then be used to construct detailed models of the crystal’s atomic arrangement.
How XRD Reveals Atomic Arrangements
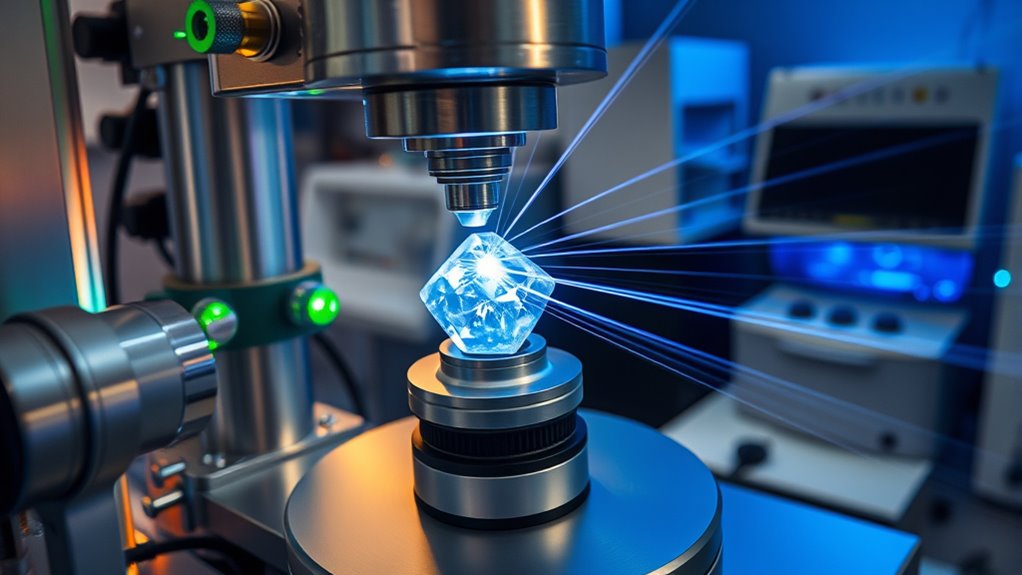
X-ray diffraction reveals atomic arrangements by analyzing the patterns created when X-rays scatter off a crystal’s atomic planes. When X-rays hit a crystal, they diffract at specific angles governed by Bragg’s law, which links X-ray wavelength, diffraction angle, and plane spacing. Constructive interference produces diffraction spots that form patterns unique to each structure. Understanding the contrast ratio is essential for interpreting the brightness differences in diffraction images, as it affects the clarity of the observed patterns. Additionally, factors like instrument calibration can influence the accuracy of the measurements and the resulting structural models. By examining these patterns’ intensity and angles, you can determine atomic positions and the crystal’s symmetry. Advanced software helps interpret the data, solving phasing problems and reconstructing three-dimensional electron density maps. From these maps, you infer atom locations, chemical bonds, and interatomic distances.
This process enables precise visualization of atomic arrangements, providing insights into crystal structure, disorder, and material properties essential across scientific disciplines.
Preparing Samples for Diffraction Analysis

Proper sample preparation is essential to obtaining accurate diffraction data. First, you should grind solid samples into a fine, talc-like powder using an agate mortar and pestle or a mechanical mill, ensuring uniform particle size. Using the appropriate headphone jack can be important if audio feedback is needed during sample preparation or analysis. Freeze-drying samples for at least 12 hours improves homogeneity and reduces moisture interference. Homogenizing and mixing the powder thoroughly helps achieve a representative sample with randomized crystallite orientations, minimizing preferred orientation effects. When mounting, fill the holder completely, pressing gently for a smooth, flat surface, and remove excess powder to reduce background noise. For specific samples, treatments like carbonate removal or clay expansion may be necessary. Incorporating automation in sample handling can increase consistency and efficiency in preparing multiple samples. Additionally, employing particle size analysis techniques can help verify uniformity in the sample, further enhancing data reliability. Advanced techniques, such as spray drying, can produce spherical granules that eliminate preferred orientation, further enhancing data reliability.
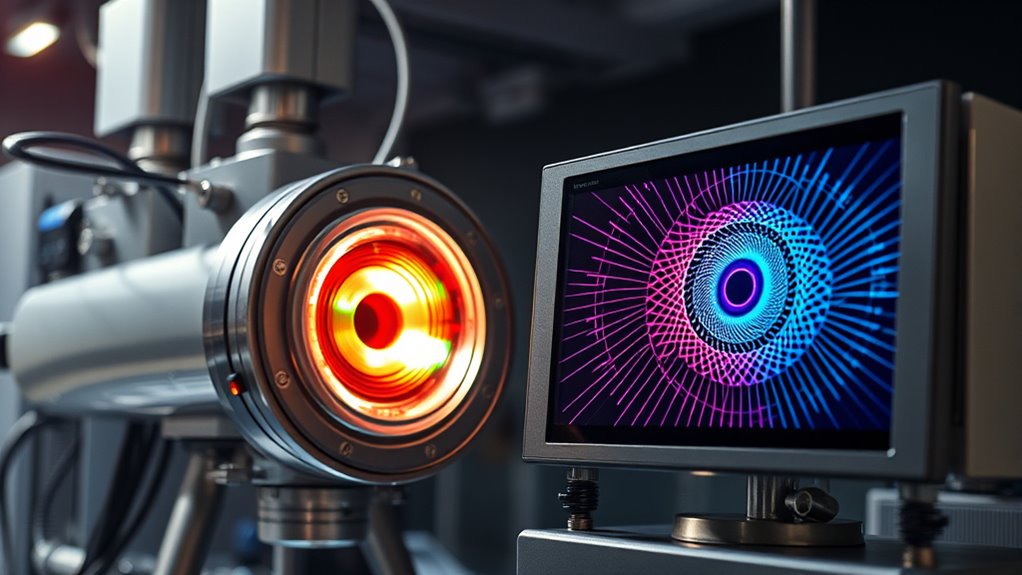
Collecting and Processing Diffraction Data

Once your samples are prepared and mounted, collecting high-quality diffraction data involves selecting suitable methods and optimizing parameters. You might use the rotation method, recording reflections as the crystal rotates slightly, or collect data from multiple stationary crystals for redundancy, especially with XFELs. Bedroom spaces can be optimized to reduce vibrations and temperature fluctuations, ensuring more precise measurements. Wide slicing collects data with larger rotation intervals, risking partial reflections and increased background noise, while fine slicing uses smaller steps, producing more accurate intensities and better signal-to-noise ratios. Proper alignment of the crystal at the beam’s rotation center, usually monitored visually, is essential. You’ll optimize detector distance to balance resolution and intensity, and set exposure times to avoid saturation. Incremental oscillations, typically 1°, are recorded over 2-5 minutes, ensuring thorough and precise data collection. Additionally, maintaining a stable environment can help prevent thermal fluctuations that might affect the diffraction quality. Utilizing advanced filtering techniques can further improve data clarity by reducing background interference.
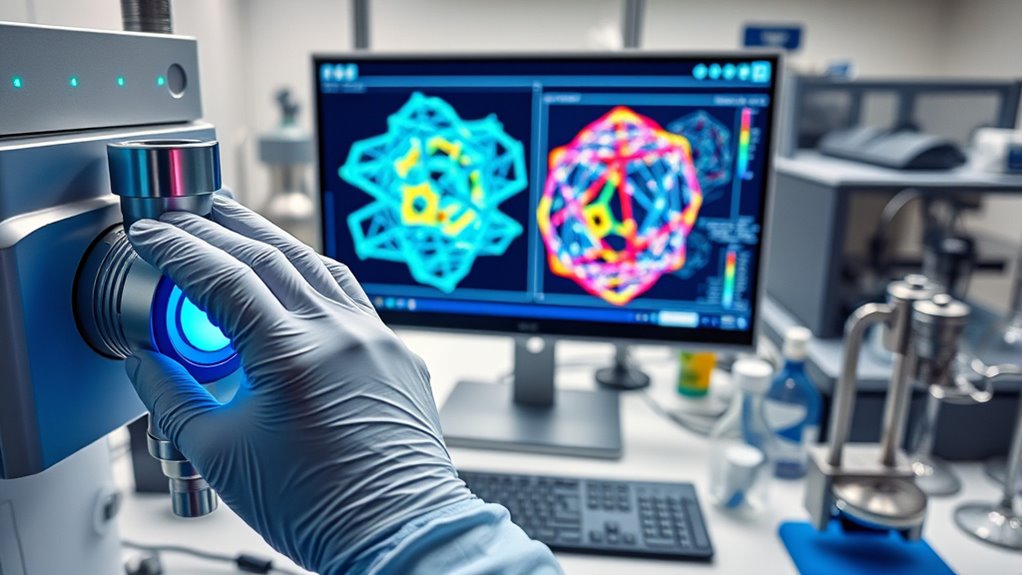
Interpreting Electron Density Maps

Interpreting electron density maps is a crucial step in understanding the three-dimensional arrangement of atoms within a crystal structure. You start by fitting atomic models into the density, which shows the distribution of electrons in the unit cell.
The Fourier transform relates structure factors to electron density, measured in electrons per cubic ångström. The map reflects an average across the crystal, not just a single unit cell.
To interpret it, you refine atomic positions, adjusting models to better match the density. Higher-resolution maps allow more precise placement, while lower resolutions reveal overall shapes.
Validation tools like RSCC help assess the fit. Be aware of limitations, such as map artifacts from phase errors or disorder, which can obscure or distort features.
Modern Computational Tools in Structure Determination
Modern computational tools have revolutionized the way you determine crystal structures from X-ray diffraction data. Tools like DiffractGPT use AI and machine learning to predict atomic arrangements directly from diffraction patterns, increasing speed and accuracy.
AI-powered tools like DiffractGPT accelerate and improve crystal structure determination from X-ray diffraction data.
They seamlessly integrate with databases, automatically matching experimental data with existing structures, which streamlines the process. These tools automate tasks such as background subtraction and lattice analysis, making structure determination more efficient.
They outperform traditional models, especially when chemical compositions are known, and provide detailed insights into material properties. In materials science, they support real-time analysis, quality control, and performance optimization.
Advances in high-performance computing and generative AI enable rapid, data-driven research, opening new avenues for automated structure prediction and cross-disciplinary collaboration.
Impact of XRD on Scientific Discoveries
How has X-ray diffraction transformed scientific discovery across various fields? You’ve seen how it shifted crystallography from theory to experiment, allowing detailed atomic insights.
In mineralogy and materials science, XRD lets you identify minerals non-destructively and understand their structures. It also revolutionized molecular biology by revealing the 3D shapes of proteins and DNA, enabling breakthroughs like the double helix discovery.
In chemistry, XRD helps characterize new compounds and develop pharmaceuticals. Recent advances now allow you to analyze single atoms, opening doors to quantum tech and medical research.
Additionally, XRD aids space exploration, analyzing extraterrestrial samples to reveal planetary compositions. Overall, XRD’s impact is profound, fueling discoveries that shape science and technology across disciplines.
Frequently Asked Questions
How Does Temperature Affect XRD Measurements and Data Accuracy?
You should know that temperature impacts XRD measurements mainly through thermal vibrations, which are described by the Debye-Waller factor. As temperature rises, peak intensities decrease and peaks broaden, complicating analysis.
Lattice parameters expand, and phase transitions may occur, changing diffraction patterns. Maintaining precise temperature control is vital, as fluctuations can affect data accuracy.
Proper equipment and software adjustments help guarantee consistent, reliable results despite temperature-related challenges.
Can XRD Analyze Amorphous or Non-Crystalline Materials Effectively?
Imagine you’re analyzing a glass ceramic; XRD reveals broad halos instead of sharp peaks, indicating amorphous nature.
You can effectively use XRD to distinguish amorphous from crystalline materials by looking for diffuse halos.
While it provides insights into local atomic arrangements, it can’t determine exact atomic positions.
Combining XRD with techniques like XAFS or simulations enhances understanding, despite challenges like overlapping signals from multiple amorphous phases.
What Are Common Challenges in Resolving Complex Crystal Structures?
When resolving complex crystal structures, you often face challenges like incorrect symmetry assignments and atom type misidentification, which can mislead your refinement process.
Noise, incomplete data, and instrumental limitations also hinder accuracy.
Additionally, computational issues such as overfitting and lack of convergence complicate analysis.
Interpretation bias and validation difficulties further threaten the reliability of your results, making careful data handling and thorough validation essential for accurate structure determination.
How Do Impurities or Defects Influence XRD Patterns?
Imagine your crystal as a clear windowpane; impurities and defects are like smudges and cracks that distort the view. They cause peak broadening, reduce intensities, and may shift peak positions.
These imperfections scatter and weaken the diffraction signals, making it harder to interpret the pattern. Small impurities appear as faint signals, while defects introduce strain and asymmetry, complicating the analysis.
This all requires careful, high-quality data collection.
What Advancements Are Expected in XRD Technology in the Next Decade?
You’ll see exciting advancements in XRD technology over the next decade. High-speed detectors will reduce data collection time and improve sensitivity, capturing weak signals more precisely.
Beamline innovations will enhance resolution and minimize damage, while AI-driven automation will streamline data analysis and experiment optimization.
Portable instruments and better integration with other techniques will make XRD more accessible, enabling you to study smaller, more complex samples quickly and accurately.
Conclusion
By mastering X-ray diffraction, you open the secrets of crystal structures hidden at the atomic level. Did you know that over 90% of known organic compounds have their structures determined through XRD? This powerful technique transforms raw data into detailed maps, guiding groundbreaking discoveries. As you explore XRD, remember you’re part of a scientific revolution that reveals the intricate beauty of nature’s building blocks, shaping innovations across medicine, chemistry, and materials science.