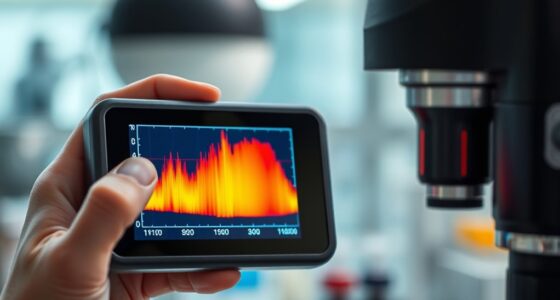

Dynamic mechanical analysis curves show how your material responds to stress and strain over time. They reveal how well it stores energy (storage modulus) and dissipates it (loss modulus), indicating damping and viscoelastic behavior. High loss modulus means more energy is lost as heat, useful for vibration control. Temperature and frequency affect these properties. To truly understand what these curves mean for your material’s performance, keep exploring the details.

Prime made for students and young adults
- Fast, free delivery for dorm and study essentials
- Prime Video and Amazon Music included
- Member-only deals
Key Takeaways
- DMA curves show how a material stores and dissipates energy under dynamic stress, revealing its viscoelastic behavior.
- The storage modulus indicates the material’s elastic energy retention, while the loss modulus reflects energy loss as heat.
- The tan delta value (loss modulus divided by storage modulus) signifies damping efficiency and energy dissipation capacity.
- Changes in these parameters with temperature or frequency reveal transitions like glassy, rubbery, or viscous states.
- Analyzing DMA curves helps predict material performance under real-world dynamic and vibrational conditions.
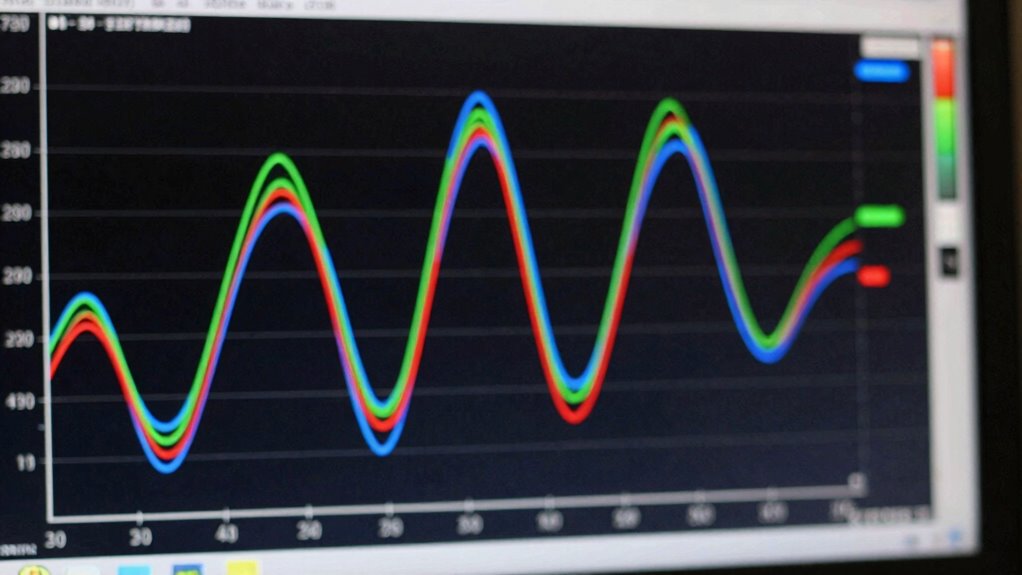
Have you ever wondered how materials respond to forces that change over time? When you apply a cyclic load or oscillate a material, it doesn’t just respond in a simple, predictable way. Instead, it exhibits complex behaviors like material damping and viscoelasticity. Dynamic Mechanical Analysis (DMA) helps you understand these responses by measuring how a material reacts under dynamic stress or strain, revealing valuable insights through the curves it produces. These curves display parameters like storage modulus, loss modulus, and tan delta, each telling a part of the story about the material’s behavior.
Material damping is a key concept in DMA. It describes how a material dissipates energy when subjected to repeated forces. Think of damping as the material’s ability to absorb vibrations and convert mechanical energy into heat. The loss modulus component of the DMA curve quantifies this damping behavior, giving you a clear picture of how efficiently the material can dampen vibrations. High damping materials are often used in applications where vibration control is critical, such as in automotive components or electronic device mounts. The curves allow you to see how damping varies with temperature, frequency, or other environmental conditions, helping you determine the suitable operating range for your material.
Material damping quantifies energy dissipation, revealing how efficiently a material absorbs vibrations and converts mechanical energy into heat.
Viscoelastic behavior is another core aspect revealed through DMA testing. Many materials aren’t purely elastic or purely viscous; instead, they exhibit a combination called viscoelasticity. This means they store some energy elastically (like a spring) while simultaneously dissipating some as heat. The storage modulus indicates how much energy the material can store elastically, while the loss modulus shows how much energy is lost during deformation. When you analyze DMA curves, the relative magnitudes of these moduli and their temperature or frequency dependence tell you whether the material behaves more like a rubber, a plastic, or a glassy solid. Understanding viscoelasticity helps you predict how materials will perform under real-world dynamic loads, especially in applications where materials experience varying forces over time. Material properties such as these are essential to designing resilient and durable systems. Recognizing the temperature dependence of these properties is crucial for ensuring materials perform well across different operating conditions.
In essence, the curves from DMA aren’t just data points—they’re a window into the dynamic world of material response. They help you grasp the complex interplay of energy storage and dissipation, revealing the material’s damping capacity and viscoelastic nature. With this knowledge, you can make smarter decisions about material selection, design, and application, ensuring your materials perform reliably under dynamic conditions. Additionally, understanding material damping can aid in developing materials tailored for specific vibration or noise reduction needs, enhancing overall system performance.
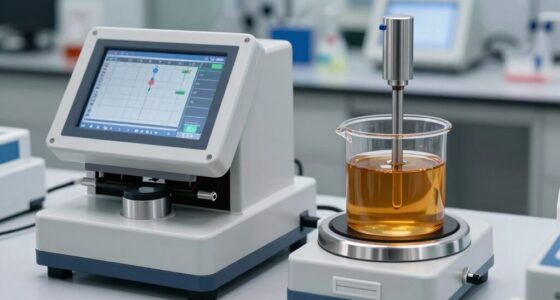
Dynamic Mechanical Analysis (DMA) instrument
As an affiliate, we earn on qualifying purchases.
As an affiliate, we earn on qualifying purchases.
Frequently Asked Questions
How Do Temperature Changes Affect DMA Results?
Temperature changes notably impact your DMA results by revealing thermal shifts like glass transition or melting points. As temperature rises, you’ll notice shifts in the storage and loss modulus, indicating changes in material stability. These transitions help you understand how your material behaves under different conditions. By analyzing these curves, you gain insights into the thermal properties and stability, ensuring your material performs reliably across temperature ranges.
What Materials Are Best Suited for DMA Testing?
You should choose materials with well-defined viscoelastic properties, like polymers, composites, and elastomers, for DMA testing. These materials respond predictably under dynamic stress, making them ideal for analyzing shifts and damping behavior. When selecting materials, consider their temperature stability and how they align with your testing protocols. Proper material selection guarantees accurate, meaningful DMA results, helping you understand material behavior across different temperatures and frequencies effectively.
How Does Frequency Influence the DMA Curves?
Frequency effects on DMA curves are like tuning a radio to catch every signal perfectly. As you increase frequency, the curves shift, revealing how materials respond faster or more sluggishly. Higher frequencies often raise the peak of the storage modulus, indicating stiffer behavior. When interpreting these curves, you see that frequency influences relaxation processes, making it vital to understand these effects for accurate material characterization.
Can DMA Be Used for Thin Films or Coatings?
Yes, DMA can be used for thin films and coatings. You can perform thin film characterization to assess properties like viscoelastic behavior and glass change temperature. This helps you evaluate coating durability under different conditions. Using DMA for thin films provides valuable insights into how coatings perform over time, ensuring they withstand environmental stresses. It’s a precise method to optimize coatings for durability and performance in various applications.
What Are Common Challenges in Interpreting DMA Data?
You might face challenges in interpreting DMA data because curve analysis can be complex, especially with overlapping peaks or subtle shifts. Variations in sample preparation, measurement conditions, or instrument calibration can affect results, making data interpretation tricky. You need to carefully analyze the curves, identify key features, and consider potential artifacts to accurately understand material behavior. Recognizing these common challenges helps guarantee more reliable and meaningful insights from your DMA data.
Conclusion
Understanding DMA curves reveals vital insights into material behavior, helping you optimize your applications. For instance, did you know that the glass shift temperature can vary by as much as 20°C based on subtle compositional changes? This highlights how even small tweaks impact performance. By interpreting these curves accurately, you gain a powerful tool to tailor materials precisely to your needs, ensuring reliability and efficiency in your projects.
Halloween Picks
halloween
As an affiliate, we earn on qualifying purchases.